Business Intelligence and Dashboard Reporting
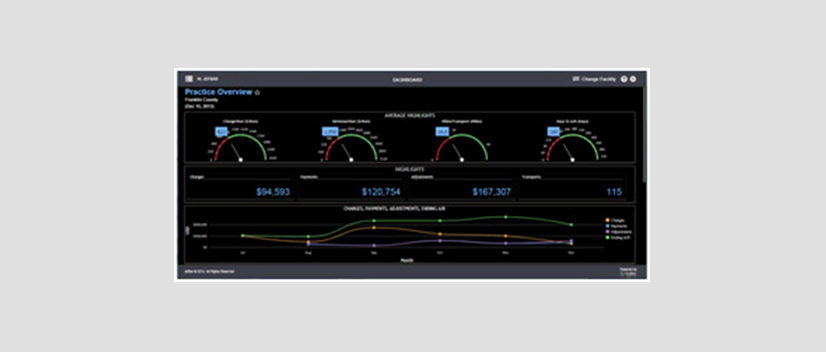
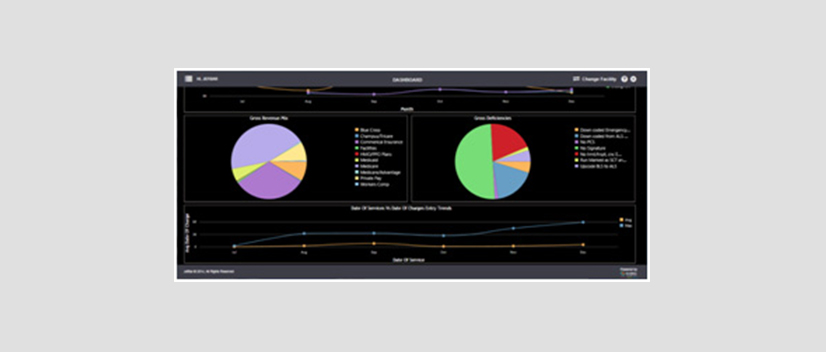
ACN Healthcare BI Dashboard is a web application; it’s a data visualization tool, which displays the current status metrics for an enterprise. On the other hand, it displays the progress over a time towards specific goals. This application identifies and delivers a graphical view in the form of various charts. In addition to this data, these reports highlight the revenue exhausted.
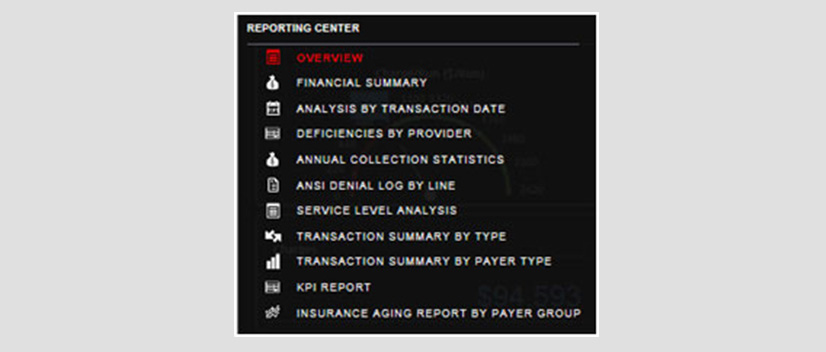
Reports include:
- Daily Highlights
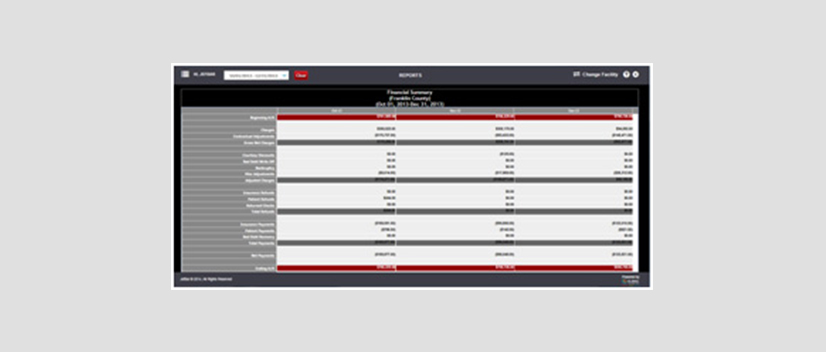
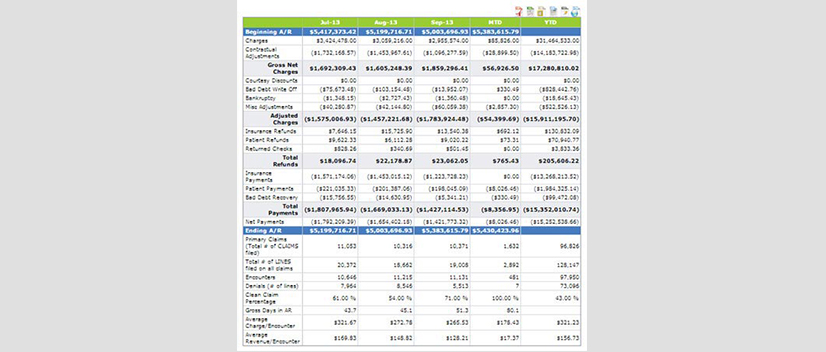
- Financial Summary
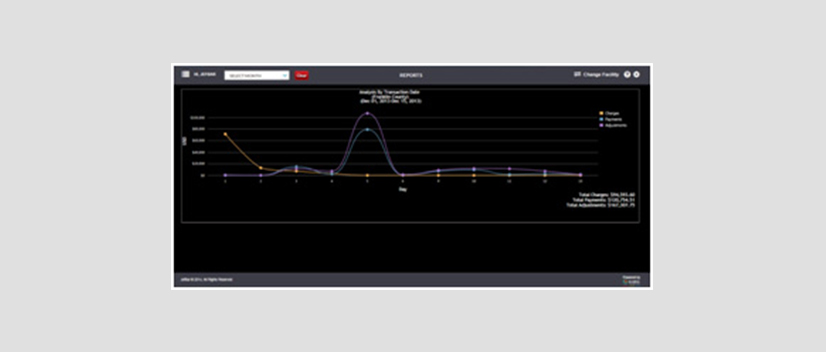
- Analysis by Transaction Date
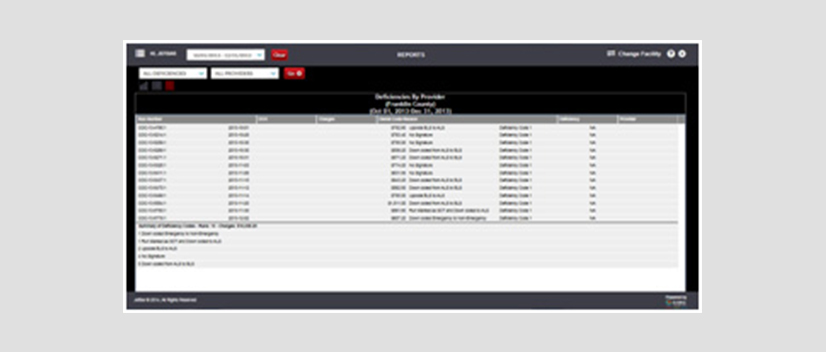
- Deficiencies by Provider
- Annual Collection Statistics
- ANSI Denial Log by Line
- Service Level Analysis
- Transaction Summary by Type
- Transaction Summary by Payer Type
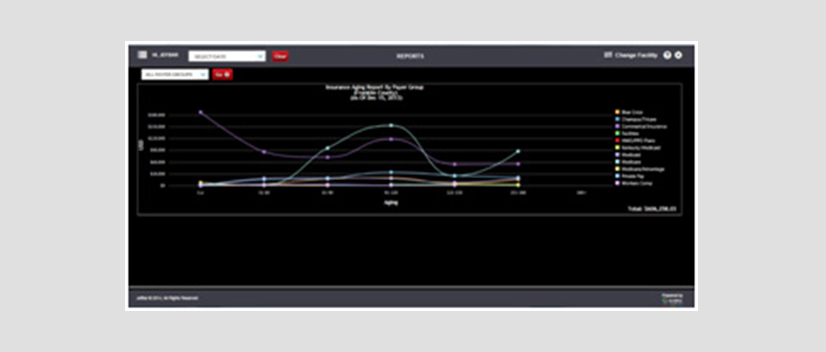
- Insurance Aging Report by Payer Group
- Practice Detail
- Gross Revenue Mix
- Gross Revenue Payer
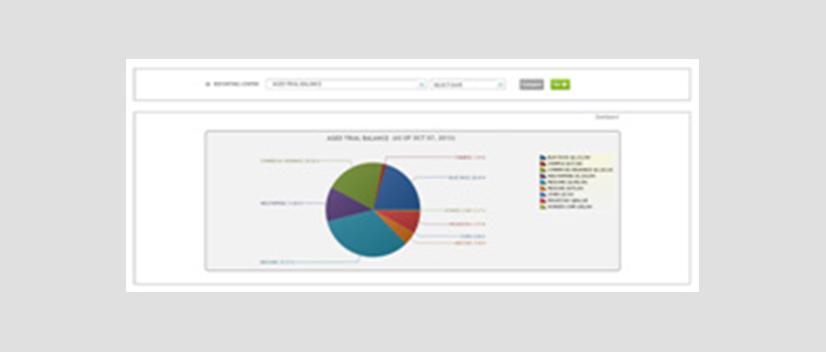
- Aged Trial Balance
- AR Aging by Date of Service
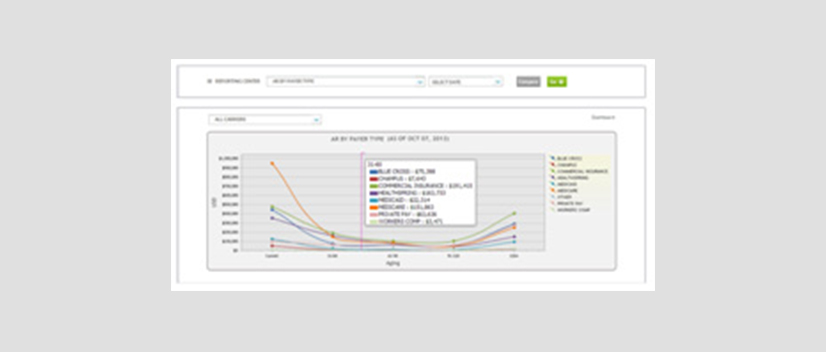
- AR Payer Mix by Payer Type
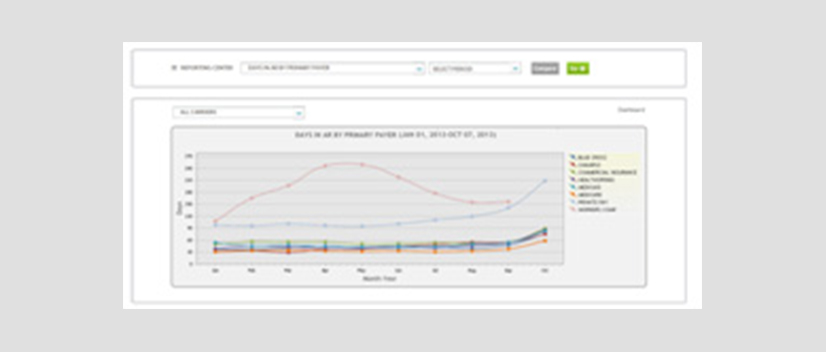
- Days in AR by Primary Payer
- Date of Service vs Date of Charge Entry
For four (4) target audiences:
- Billing Companies (both Physician and Ambulance)
a. Access to the above reports, with daily feeds and automated monthly reporting - End Customers
a. Access to their individual site – allowing quick view to Cash Flow, Days in AR, Payer Mix, etc. - Radiology Centers
a. Provides review of modalities and number of each performed throughout the month against pre-set targets
b. RVU calculations
c. Breakdown by Reading Physician, Referring Physician, etc. - Hospitals
a. HL-7 Messaging compared to Charge Master to ensure all procedures are billed out correctly
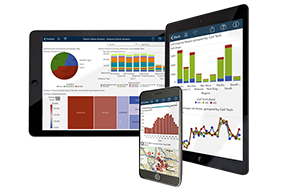
The data is displayed in custom User Defined Dashboards which integrates with any billing system and available on the iPad thru the App Store and Android devices thru the Play Store.